RAR
R Package for Rest Activity Rhythm analysis
RAR: R Package for Rest Activity Rhythm analysis
This package is intended for easy extraction of features of rest activity rhythms (RARs) collected using actigraphy data that has ben condensed into epochs (e.g. activity counts within 30 second, 60 second, etc epochs). This package utilizes three main approaches for analysis:
- Parametric Approach: Sigmoidally transformed extended cosine models
- Residual Circadian Spectrum Analysis: Spectral analysis based on residuals of fitted cosine models
- Localized Measures: Mean, standard devation, and relative activity measures within user-specified time bins.
Example of activity patterns estimated using RAR
Sigmoidally transformed extended cosine models
 Figure 1. 60-second epoch RAR data with fitted antilogistic cosine model (red). Top right: residuals estimated from the fitted anti-logistic model.
See Marler et al. 2006 for a summary of the model structure and parameters estimated from the models.
Residual Circadian Spectrum Analysis
 Figure 2. Top left: 60-second epoch RAR data with fitted antilogistic cosine model (red). Top right: residuals estimated from the fitted anti-logistic model. Bottom left: estimated log power spectrum of the residuals from the top right panel with a smoothing cubic spline (blue). Bottom right: example of frequency band selection (a, b) to estimate frequency band score.
Spectral analysis is performed on the residuals of derived from the anti-logistic extended cosine model. From there, a user-specified specified band (a, c) for which the area under the smoothed spectrum is estimated.
See Krafty et al. 2019 for methodology underlying residual circadian spectrum analysis and frequency band estimation.
Localized Measures
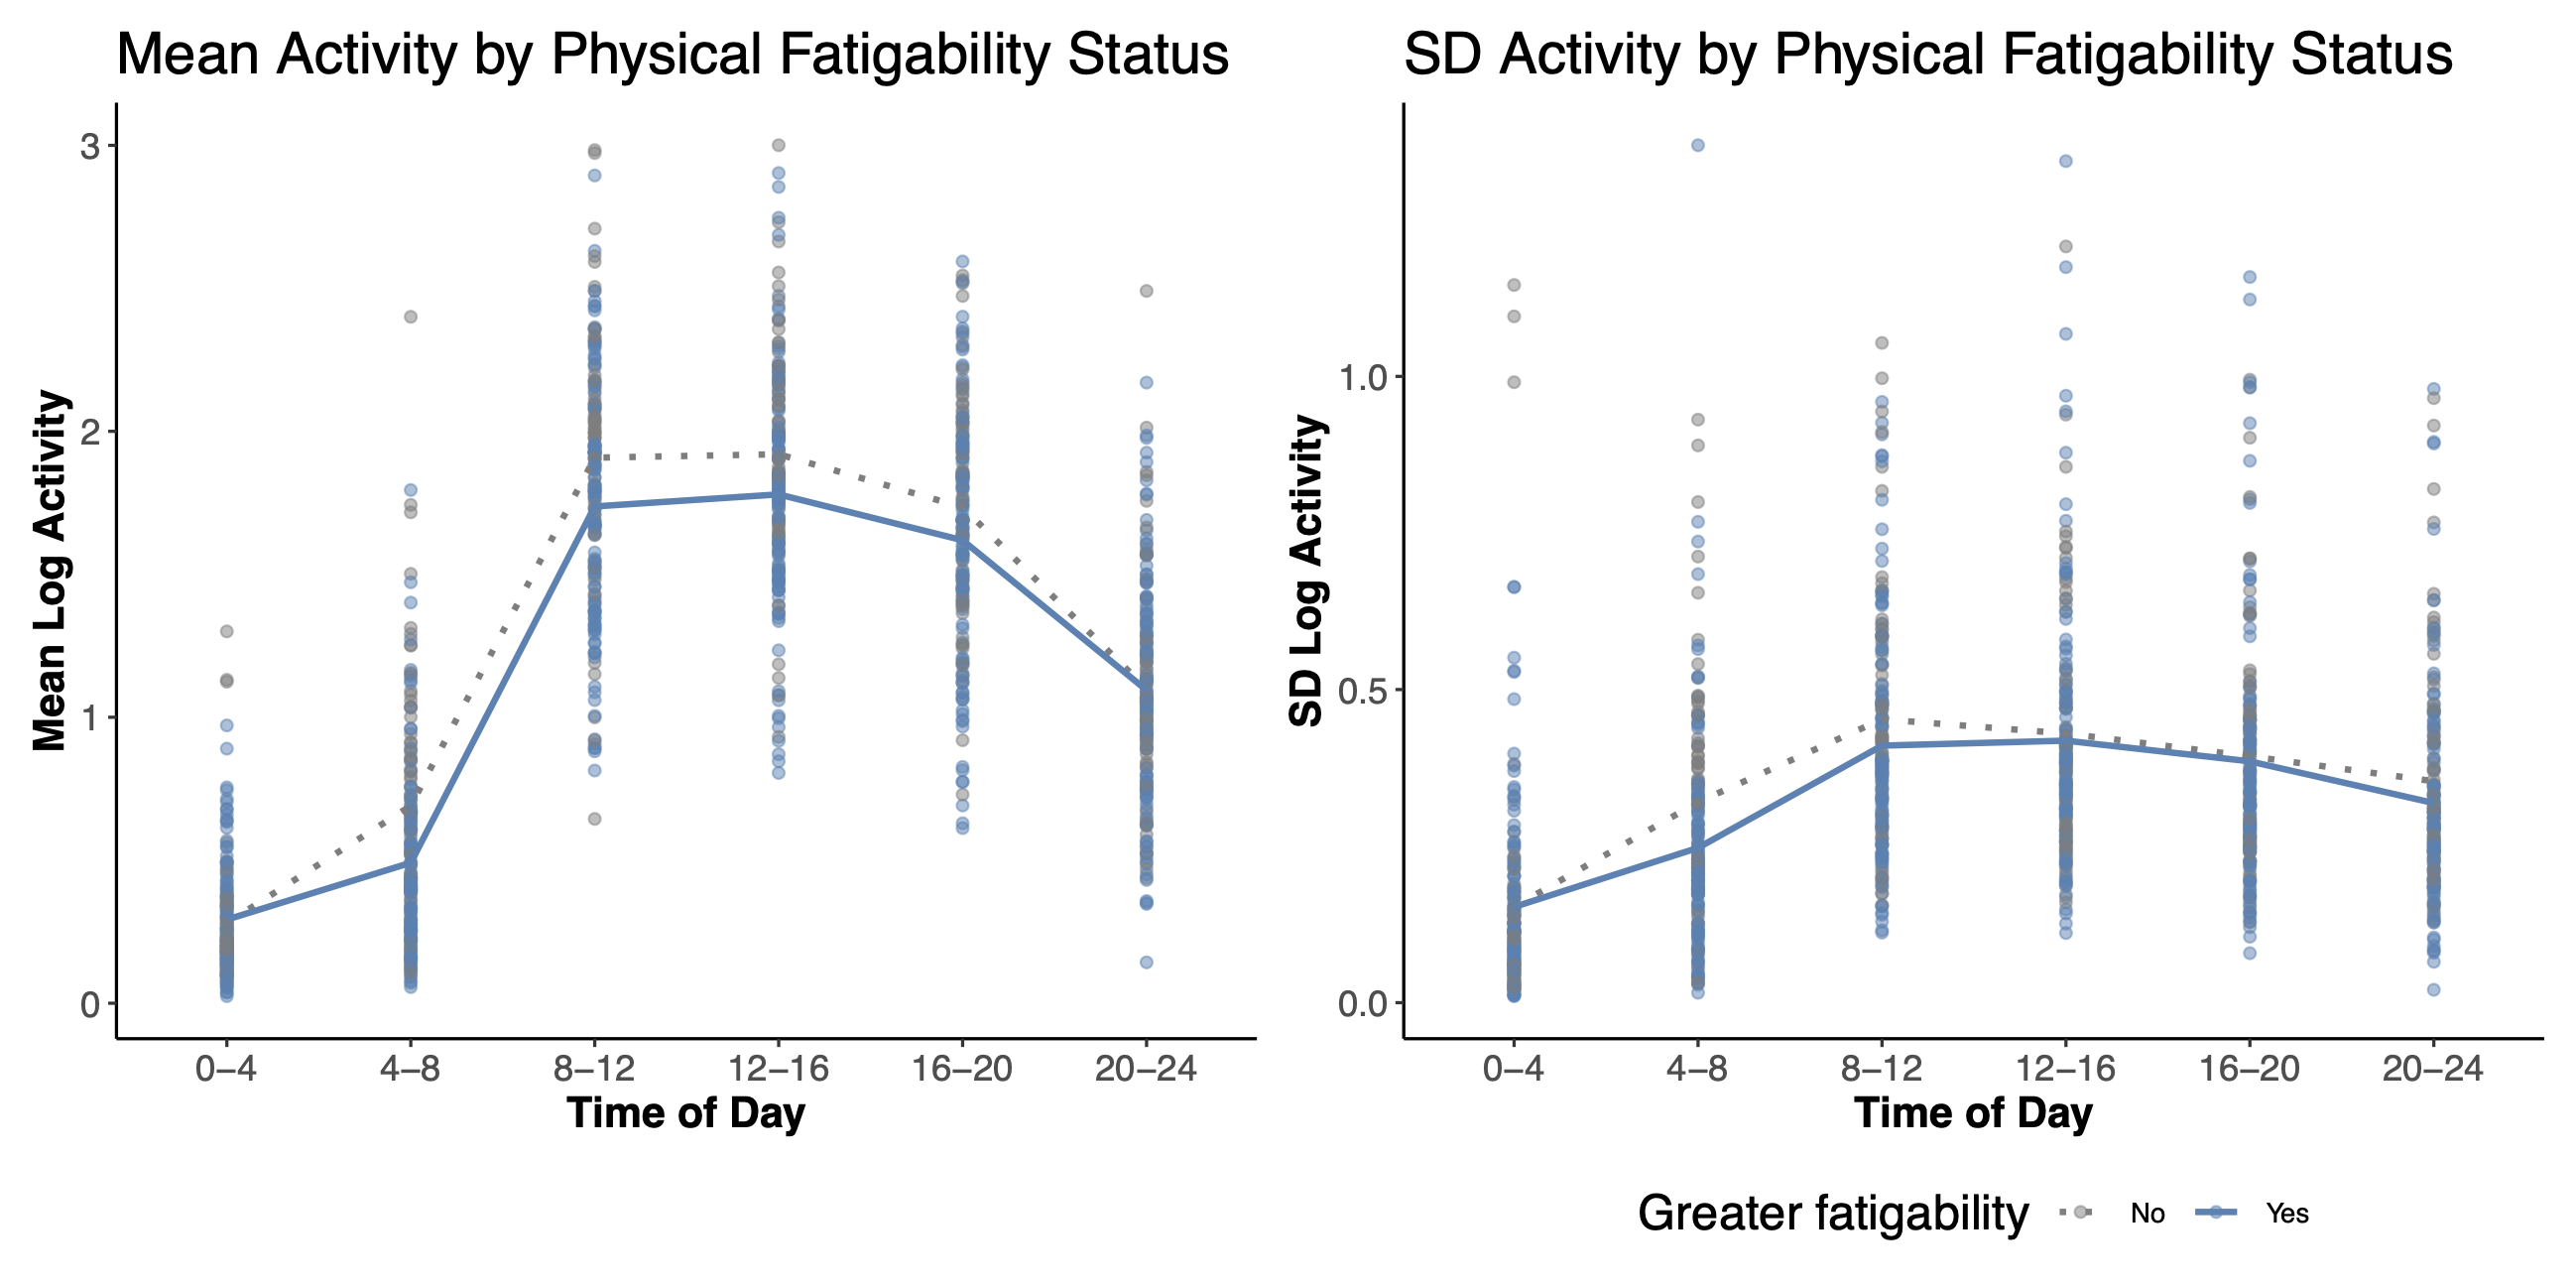 Figure 3. Example of mean and SD of activity estiamted using RAR_Local function. Mean and standard deviation of daily log activity counts stratified by the Pittsburgh Fatigability Scale (PFS) at 4-h time bin intervals. Solid line represents greater perceived physical fatigability (PFS ≥ 15); dotted line represents lesser perceived physical fatigability (PFS < 15). Taken from Graves et al. 2021, Sensors
Basics of using RAR
install_github("JessLGraves/RAR")
data(age_wise) # example dataset
d <- age_wise

#### Cosine Modeling
rar_ex <- RAR(d, act, date_time, id_column=id)
rar_ex$parameters # parameter estimates
rar_ex$messages # convergence messages for each participant
rar_ex$df_predicted # dataframe of obseved activity and predicted values
rar_ex4df_interp # predictions based on interpolated data (i.e. missing data)

### Residual Circadian Spectrum
spec <- RAR_Spectrum(rar_ex, "pss", TRUE, id)
RAR_Spectrum_plot(spec, ids=c("1, "29)) # plotting only participants 1 and 29
# Frequency band selection
f1 <- c(0, 2/24); f2 <- c(2/24, 25); f3 <- c(25, 60)
fs <- rbind(f1, f2, f3)
bands <- RAR_SpectrumBands(spec, fs, id_column=id) # frequency band score for each frequency interval

### Localized Measures
hour_interval <- 4
local <- RAR_Local(d, act, date_time, hour_interval, id_column=id)
local$localized # print of mean, sd, relative activity for each 4-hour time interval
# plotting mean, sd, and relative activity
local_plots <- RAR_Local_plot(local, id_vals=c("1", "29"))
  local_plots$plot_mean
  local_plots$plot_sd
  local_plots$plot_rel
Publications which have used RAR
- Graves, Jessica L., et al. “Profiles of Accelerometry-Derived Physical Activity Are Related to Perceived Physical Fatigability in Older Adults.” Sensors 21.5 (2021): 1718. link
- Smagula, Stephen F., et al. “Activity patterns related to depression symptoms in stressed dementia caregivers.” International psychogeriatrics (2019): 1-8. link